

A grade is personal!
If you are a parent of a teenager, you can probably relate to this scenario:
Parent: How did you do on the last assignment? Did you get your grade back?
Teenager: Yup. (throws the paper on the table)
Parent: Oh! I really thought you understood this work. What happened?
Teenage: I don’t know. The teacher hates me.
For this student, there is a measure of truth in this scenario. The perception that the teacher has control, by decreeing the grade, seems very real and feeds a sense of ‘whatever’. The student may even assume that the teacher is applying this grade as a form of revenge or ‘got ya’. We know that’s probably not the case but for a young person, it’s personal!
Everyone has a predetermined mental construct of grades simply by the fact that we all went to school and experienced grades. Whether you went to school in the 1950s or the year 2000 you know that an A is better than a D; 90% is better than 60%. But what do these symbols say about what was achieved? What feedback do these provide to move learning forward?
The Ontario Context
Ontario, like a number of other jurisdictions world-wide, has moved from norm-referenced to criterion-referenced assessment and evaluation. This means that teachers assess and evaluate student work with reference to established criteria for four levels of achievement that are standard across the province, rather than by comparison with work done by other students, or through the ranking of student performance, or with reference to performance standards developed by individual teachers for their own classrooms. (Growing Success, p. 19)
As consultants supporting educators and administrators for over two decades, we both believe in harnessing the power of assessment see the assessment loop).
This includes:
- Establishing collaborative partnerships with learners,
- Determining and setting learning goals derived from big ideas, curriculum, and authentic contexts,
- Designing tasks that provoke thinking and learning,
- Co-constructing success criteria using samples and modelling,
- Involving students in the assessment process though self and peer assessment, and
- Reflecting on learning to set personal goals.
A call for transformed evaluation and reporting practices
The reality is that educators in Ontario, and across many jurisdictions in the world, work in two very different paradigms simultaneously: one, where effective instructional practices reside in assessment for learning strategies; the other, where a reporting system necessitates letter grades or a 100-point system of percentages. Formal reporting periods are the most confusing and bewildering times for educators as they try to navigate this morass and make sense of the evidence they and their students have gathered to best represent the learning of each student.
As retired educators and bloggers, it’s easier for us now to promote reporting practices which go against commonly held beliefs but are shown to be more effective in communicating about learning and supporting learners. We would advocate for an alignment between everyday classroom strategies and formal reporting systems. If ‘the goal of using a criterion-based approach is to make the assessment and evaluation of student achievement as fair, reliable, and transparent as possible’ (Growing Success, p. 29), then let’s make it happen! Let’s use criterion-based strategies and four levels of achievement (just four; not pluses and minuses) throughout the learning phase, as we monitor and and help learners to consolidate growth over time. Communication of progress would be readily available at all stages of learning but more formal reporting could be through student generated portfolios summarizing growth. This would support making thinking visible and would showcase demonstrations of learning rather than relying on symbols, letters or percentages that hold little significance.
Every principal we have ever worked with has stated emphatically that parents expect educators to know their son or daughter. Criterion referenced strategies lend themselves to sharing samples of student work that describe what successful work looks like. The evolution of reporting could progress to a stage where students are able to explain their own strengths and identify areas of improvement to their parents/guardians. (Helene witnessed this process with her own grade 7 students back in 1999!) Isn’t that the goal, for students, even the youngest, to become self-monitoring, autonomous learners?
Now for a reality check: while we aspire to the reporting system just described, we realize that the report card paradigm has not collapsed (yet). Over the past few weeks, we have written a series of posts highlighting how determining a grade is a thinking process that intentionally and mindfully lays out a criterion-based approach to calm the acute sense of urgency bubbling up during the reporting phase of learning. Visit these prior posts:
- Where do I go from here? (Visualizing and planning where you want the learning to go)
- Are the trees still growing up? (Organizing for grading)
- Are you a planner or a ‘pantser’? (Engaging the planner in you)
- Organizing, monitoring and gathering evidence (Checking in)
- Determining a grade (Selecting relevant data)
- Applying professional judgment
Replacing the coach’s cap with an evaluator’s hat
As the deadline for report cards looms, it’s time for educators to analyze and interpret the data to capture an accurate representation of each student’s learning at this moment in time. Planning for grading, a process developed over many weeks, enables the educator to be ready to consolidate the evidence, summarize it as a mark or grade, and write a comment that highlights a significant strength, an area for improvement and a corresponding next step.
Some Important Notes
In the examples that follow, we recognize the data represents but a fraction of the evidence accumulated by both the educator and the student since the previous reporting period. As suggested in previous posts, we wanted to demystify the thinking process of determining the grade in order to tease out the simplicity on the other side of complexity, so we have reduced the amount of evidence in our example.
In writing this post, we’re faced with somewhat of a dilemma. We, in Ontario, are guided by a policy which requires teachers of Grades 1 to 6 to grade using letter grades, including pluses and minuses (+/-). Teachers of Grades 7 to 12 use percentage marks. If you work in other jurisdictions, you may be required to use letter grades, levels, percentage marks, or other means of summarizing learning. In the spirit of trying to be as helpful as possible, we will give an example of each scenario using the evidence collected by a Grade 8 teacher of Science, Math and Language. (If you’ve been reading our previous posts in this series, you’ll have followed the process for how this evidence was gathered.)
In the first example, we model how to determine a grade based on our preferred reporting model: This teacher is using four levels (no +/-) to summarize the learning.
After that, we provide a suggestion for how you might determine a percentage grade, as is required for Ontario teachers of Grades 7 to 12.
What might this look like?
Determining a Level or Letter Grade
Brookhart & Nitko (2014) suggest that we “take the median grade a student achieves on a standard after his performance ‘settles’ into a reliable level of proficiency.” This approach aligns with the practice of considering the most consistent, more recent performances when interpreting the evidence to determine the grade.
Let’s continue to follow the thinking of a grade 8 teacher of Science, Math and Language as they reflect on their own thinking while entering into the evaluative phase of learning. (Previous posts illustrate the teacher’s thinking process from the beginning of this cycle of learning as they planned for grading.)
I’ve been monitoring the artefacts continuously against the learning goals and success criteria and made instructional adjustments as needed during the learning phase. Students have had multiple opportunities to self assess and receive feedback from myself and their peers in order to do their best work. I saw the trends developing over time, validated through hard copies of their efforts and through my observations and conversations with each student. I’ve simplified my template to show only the compilation of assessments of learning but all assessments for and as learning are figuratively wrapped around this data; it is part of my thinking process. I planned for grading; the students and I worked together to achieve success but it is time to take off my coach’s hat and take up the role as evaluator. I am ready and confident in finding the most consistent level of achievement with special consideration for more recent attempts (Growing Success, p. 39).
Student A:
Like many others in this cohort, Student A started off demonstrating the basic success criteria of the Systems in Action Science unit (i.e. identifying types and purposes of systems). The pre-assessment concept page allowed me to see what the students thought they knew and I could pinpoint any misconceptions right from day one. It was fascinating to have the students return to this concept page several times during the learning phase so they could add or change information.
After meeting with Student A several times to discuss his work, I was able to push his thinking by relating systems to deeper concepts of assessing impact, taking different points of view and identifying social and environmental influences on a system. He was able to apply these concepts from consolidation of virtual discussions and readings to the final task of designing a system. Level 4 thinking is consistently evident.
The big ideas from Science were bolstered by overall expectations from other content areas, including Mathematics, Language strands (i.e. writing, Media Literacy, Reading and Oral Communication). I will cross reference this achievement with other artefacts from these content areas to determine a grade for reporting purposes.
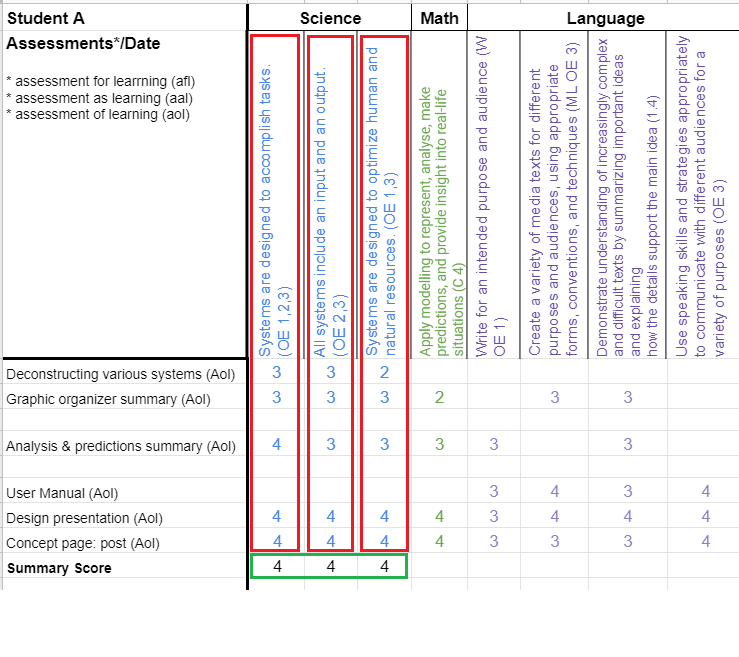
Looking down the column for each big idea for Science reveals that levels 3 and 4 are the most consistent results, with more recent results centering on a Level 4. As a result, I summarized the evidence for each big idea as a Level 4. I then took the median of these summary scores which resulted in a Level 4 as the report card grade for this student.
As mentioned earlier, Ontario teachers use letter grades as reporting symbols for students in Grades 1 to 6. The policy, Growing Success, (p. 40), provides a conversion chart to show how letter grades relate to levels.
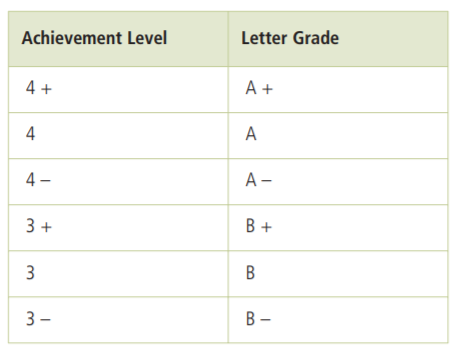
Level 4 converts to an “A”. Teachers may also use +/- to specify their professional judgments within the range. In any case, the same thinking process is applied.
Determining a Percentage
Determining a percentage grade from evidence is challenging. Guskey (2013) points out, “Overall, the large number of grade categories in the percentage grading scale and the fine discrimination required in determining the differences among categories allow for the greater influence of subjectivity, more error, and diminished reliability. The increased precision of percentage grades is truly far more imaginary than real.”
We offer an example, but caution that there is no one best way to determine a percentage. The issue with percentage grades is the illusion of precision that Guskey identifies. There are several options. Teachers can grade individual assignments using percentage marks, or convert the summary scores for standards/big ideas to a percentage, or determine the final grade as a level, and then convert. There are challenges with each of these. Let’s look at evaluating a performance with a percentage:
If you are using a rubric to evaluate a single performance, the challenge is to convert a rubric level into a percentage.
If you do it ‘mathematically’, you may end up distorting the meaning of the levels. For example, if a student achieves a Level 2 on a 4-level rubric, it is tempting to convert this to a 2 out of 4, which mathematically produces a percentage mark of 50%. However, according to Ontario’s grading policy, a Level 2 converts to a percentage in the range of 60 – 69.
If you use a marking scheme, you will identify a total point score that could be achieved, and a student’s result. A marking scheme allows you to measure the ‘percentage correct’. For example, if the total point score is 60, and the student has 40 points, the percentage will be 40/60 = 67%. However, measurement experts warn that the greater the number of categories (0 to 100) the greater the risk of statistical error in measurement. Guskey (2013) cautions, “Percentage grades derived solely from the percentage correct, without careful examination of the items or tasks students are asked to address, are just not all that meaningful.” Further, in order to determine the student’s achievement of each standard or concept, the marking scheme needs to be broken down so that points relating to each standard are identified.
For this reason, we suggest that the conversion to a percent take place later in the grading process — once the summary score has been determined. You’ll note in the following example that the teacher has used +/- to evaluate the student’s demonstrations of learning. This is an attempt to provide the “increased precision” that is required to convert from a level to a percentage.
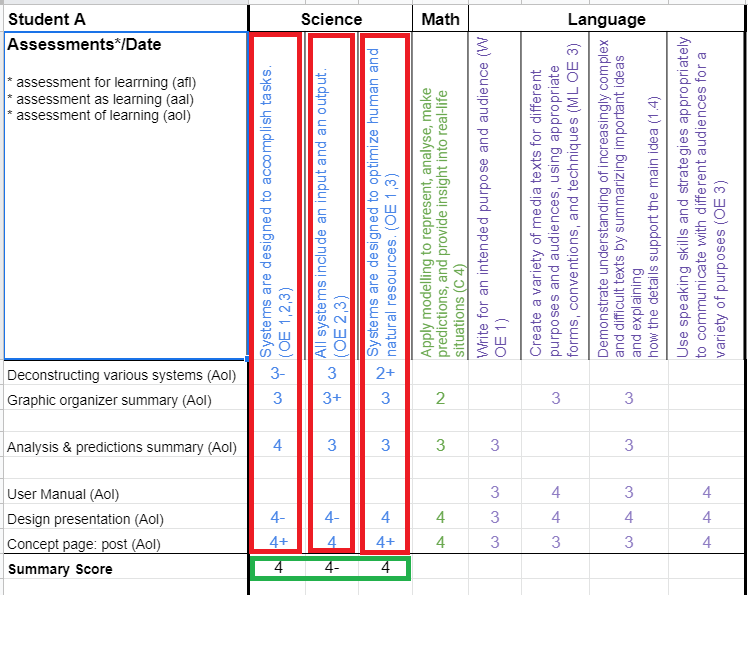
Looking down each column, I apply the criteria of most consistent, more recent. In the first column, the more recent grades are 4-, 4+, 4. There is no one consistent grade, but all of the results are in the Level 4 range. I take the median of these three grades (the middle mark when the grades are listed from lowest to highest), which is 4.
The same process is applied to each of the other columns. To determine a final grade, I convert the three grades, one from each column, into a percentage mark using the conversion chart in the policy (see page 40), and then find the mean.
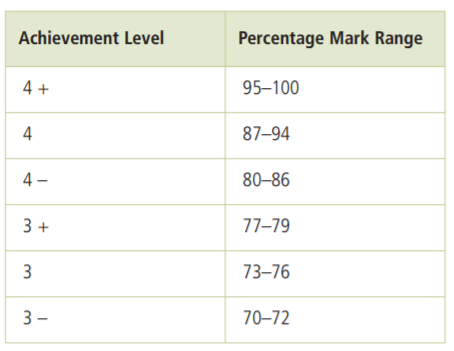
The conversion chart equates each level with a range of percentages. For example, 4- is any mark from 80 – 86. This is one of the challenges involved in using percentage marks. Which of the 7 percentage marks in this range do you choose? This is left up to a teacher’s professional judgment.
I converted 4- to 86 and 4 to 94. The mean of these is (86 + 94 + 94)/3, or 91. This is the percentage mark that I will assign to this student on the report card.
If the teacher had decided to use the middle mark in the range (83, 91, 91), the result would be 88.
If the teacher had decided to use the lowest mark in the range (80, 87, 87), the result would be 85. Notice that according to the conversion chart, 85 equates to a Level 4. However, with a 4-, 4, 4 result, the final report card grade should represent a Level 4, so this is not an option.
Student B
Student B is a great example of starting off strong but falling behind in demonstrating the established success criteria even though through observation, I knew she had the thinking and the skills to succeed! After conferring with her in mid-May to investigate what was happening, it became apparent that she wasn’t uploading artefacts to her digital portfolio. Once we worked on self regulating her work habits I was able to accurately assess her achievement. The entries in the template may not be consistent but newer, more recent attempts replaced older, outdated evidence of learning.
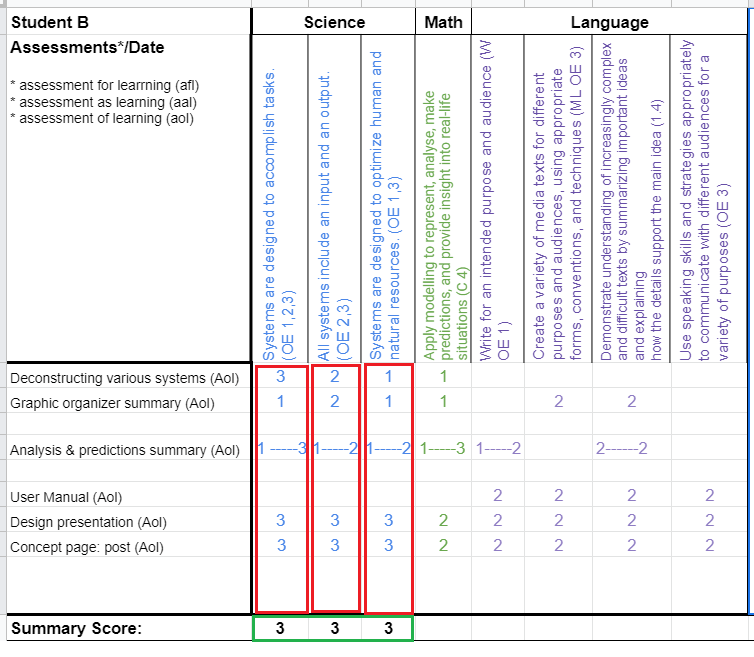
Looking down each column, the more recent, most consistent level of achievement is 3. In Science I am evaluating her grade to be level 3.
In formulating a comment, I have identified that a significant strength is in making connections to the overall expectations in Science. Picking out an area of improvement that would help learning next year relates to communicating her ideas by synthesizing ideas and presenting information clearly.
Student C
The pandemic impacted the learning environment for Student C. She struggled with attendance in the virtual class and did not attempt nor complete many assignments. When questioned during the mid-May conference, she had made relevant real-world connections to the social and environmental influences of systems. She was acutely aware of how her family was impacted by the changes of the last 15 months! She passionately discussed these with me yet seemed reluctant to communicate her understanding.
These are difficult times. Sometimes evaluation is about harvesting what a student knows and can do hidden below the surface. Fairness and equity is not always about everyone being equal or accomplishing exactly the same thing. Equity is about compassion and ‘seeing’ the truth and hearing the voice of each student. I have applied my professional judgment and determined the grade for Student C at level 3 supported by her deep insights from life lessons learned. I humbly acknowledge that she took a different pathway to learning than most of the students in this cohort but I recognize the validity of her learning journey.
It is important to note that the grade determined for Student C is still based on documented evidence. The teacher adjusted the assessment process for Student C by providing additional conferences and changing the culminating task requirements to allow for Student C to reflect on this unique moment in time, while still meeting the success criteria. The teacher and student used various tools to document the evidence, including the evidence provided orally through the conferencing.
You may have read through this series of posts and had many questions: perhaps you disagreed with our approach; perhaps you have additional ‘what if’ questions.
Coming to consensus related to the process of determining the grade has been an ongoing issue since well before the release of Growing Success. We’ve heard a multitude of comments over the years: “The Ministry just needs to tell us exactly what to do!”, “This approach will never work in my content area!”, or “Let’s all use the same mathematical calculation for the sake of consistency.” In a rarely cited document, Consistency in Classroom Assessment (CODE, 2006), authors of the document concluded that consistency is not achieved by educators doing the same thing but rather engaging in a collaborative process by planning together and moderating samples of student work based on established criteria. Striving for deep understanding of levels of achievement and the application of the principles of fair assessment supports a realistic and more accurate portrayal of achievement for each student.
One last thought and a call to action:
“Assigning fair and meaningful grades to students will continue to challenge educators at every level. The process requires thoughtful and informed professional judgment, an abiding concern for what best serves the interests of students and their families, and careful examination of the tasks students are asked to complete and the questions they are asked to answer to demonstrate their learning. “ (Guskey, 2013)
We would love to hear your thoughts! Be part of the conversation by sharing a process for determining the grade that you and your colleagues have developed over time.
References:
Brookhart, S. M. & Nitko, A. J. (2014). Educational assessment of students (7th Ed.). Pearson.
Council of Ontario Directors of Education (CODE). (2006, May). Consistency in classroom assessment. Support materials for educators. A resource document compiled by CODE for the Ministry of Education. Retrieved July 9, 2007 http://www. principals.on.ca/cms/documents/CODE-consistency.pdf
Guskey, T. (2013). The case against percentage grades. Educational Leadership, 71(1), 68-72. https://tguskey.com/wp-content/uploads/Grading-2-The-Case-Against-Percentage-Grades.pdf
Ontario Ministry of Education. (2010). Growing Success: Assessment, Evaluation, and Reporting in Ontario Schools. First Edition, Covering Grades 1 to 12, 2010.. Toronto, ON: Queen’s Printer.
Further Reading:
Brookhart, S. M. (2017). Hot to use grading to improve learning. ASCD.
Cornue, J. (2018). Changing the grade: A step-by-step guide to grading for student growth. ASCD.
Educational Leadership. Grade Expectations. September 2020 78(1).
Guskey, T. R. (2015). On your mark: Challenging the conventions of grading and reporting. Solution Tree.
Guskey, T. R. & Bailey, J. M. (2001). Developing grading and reporting systems for student learning. Corwin Press, Inc.
Marzano, R. J. (2000). Transforming classroom grading. ASCD.

2 comments